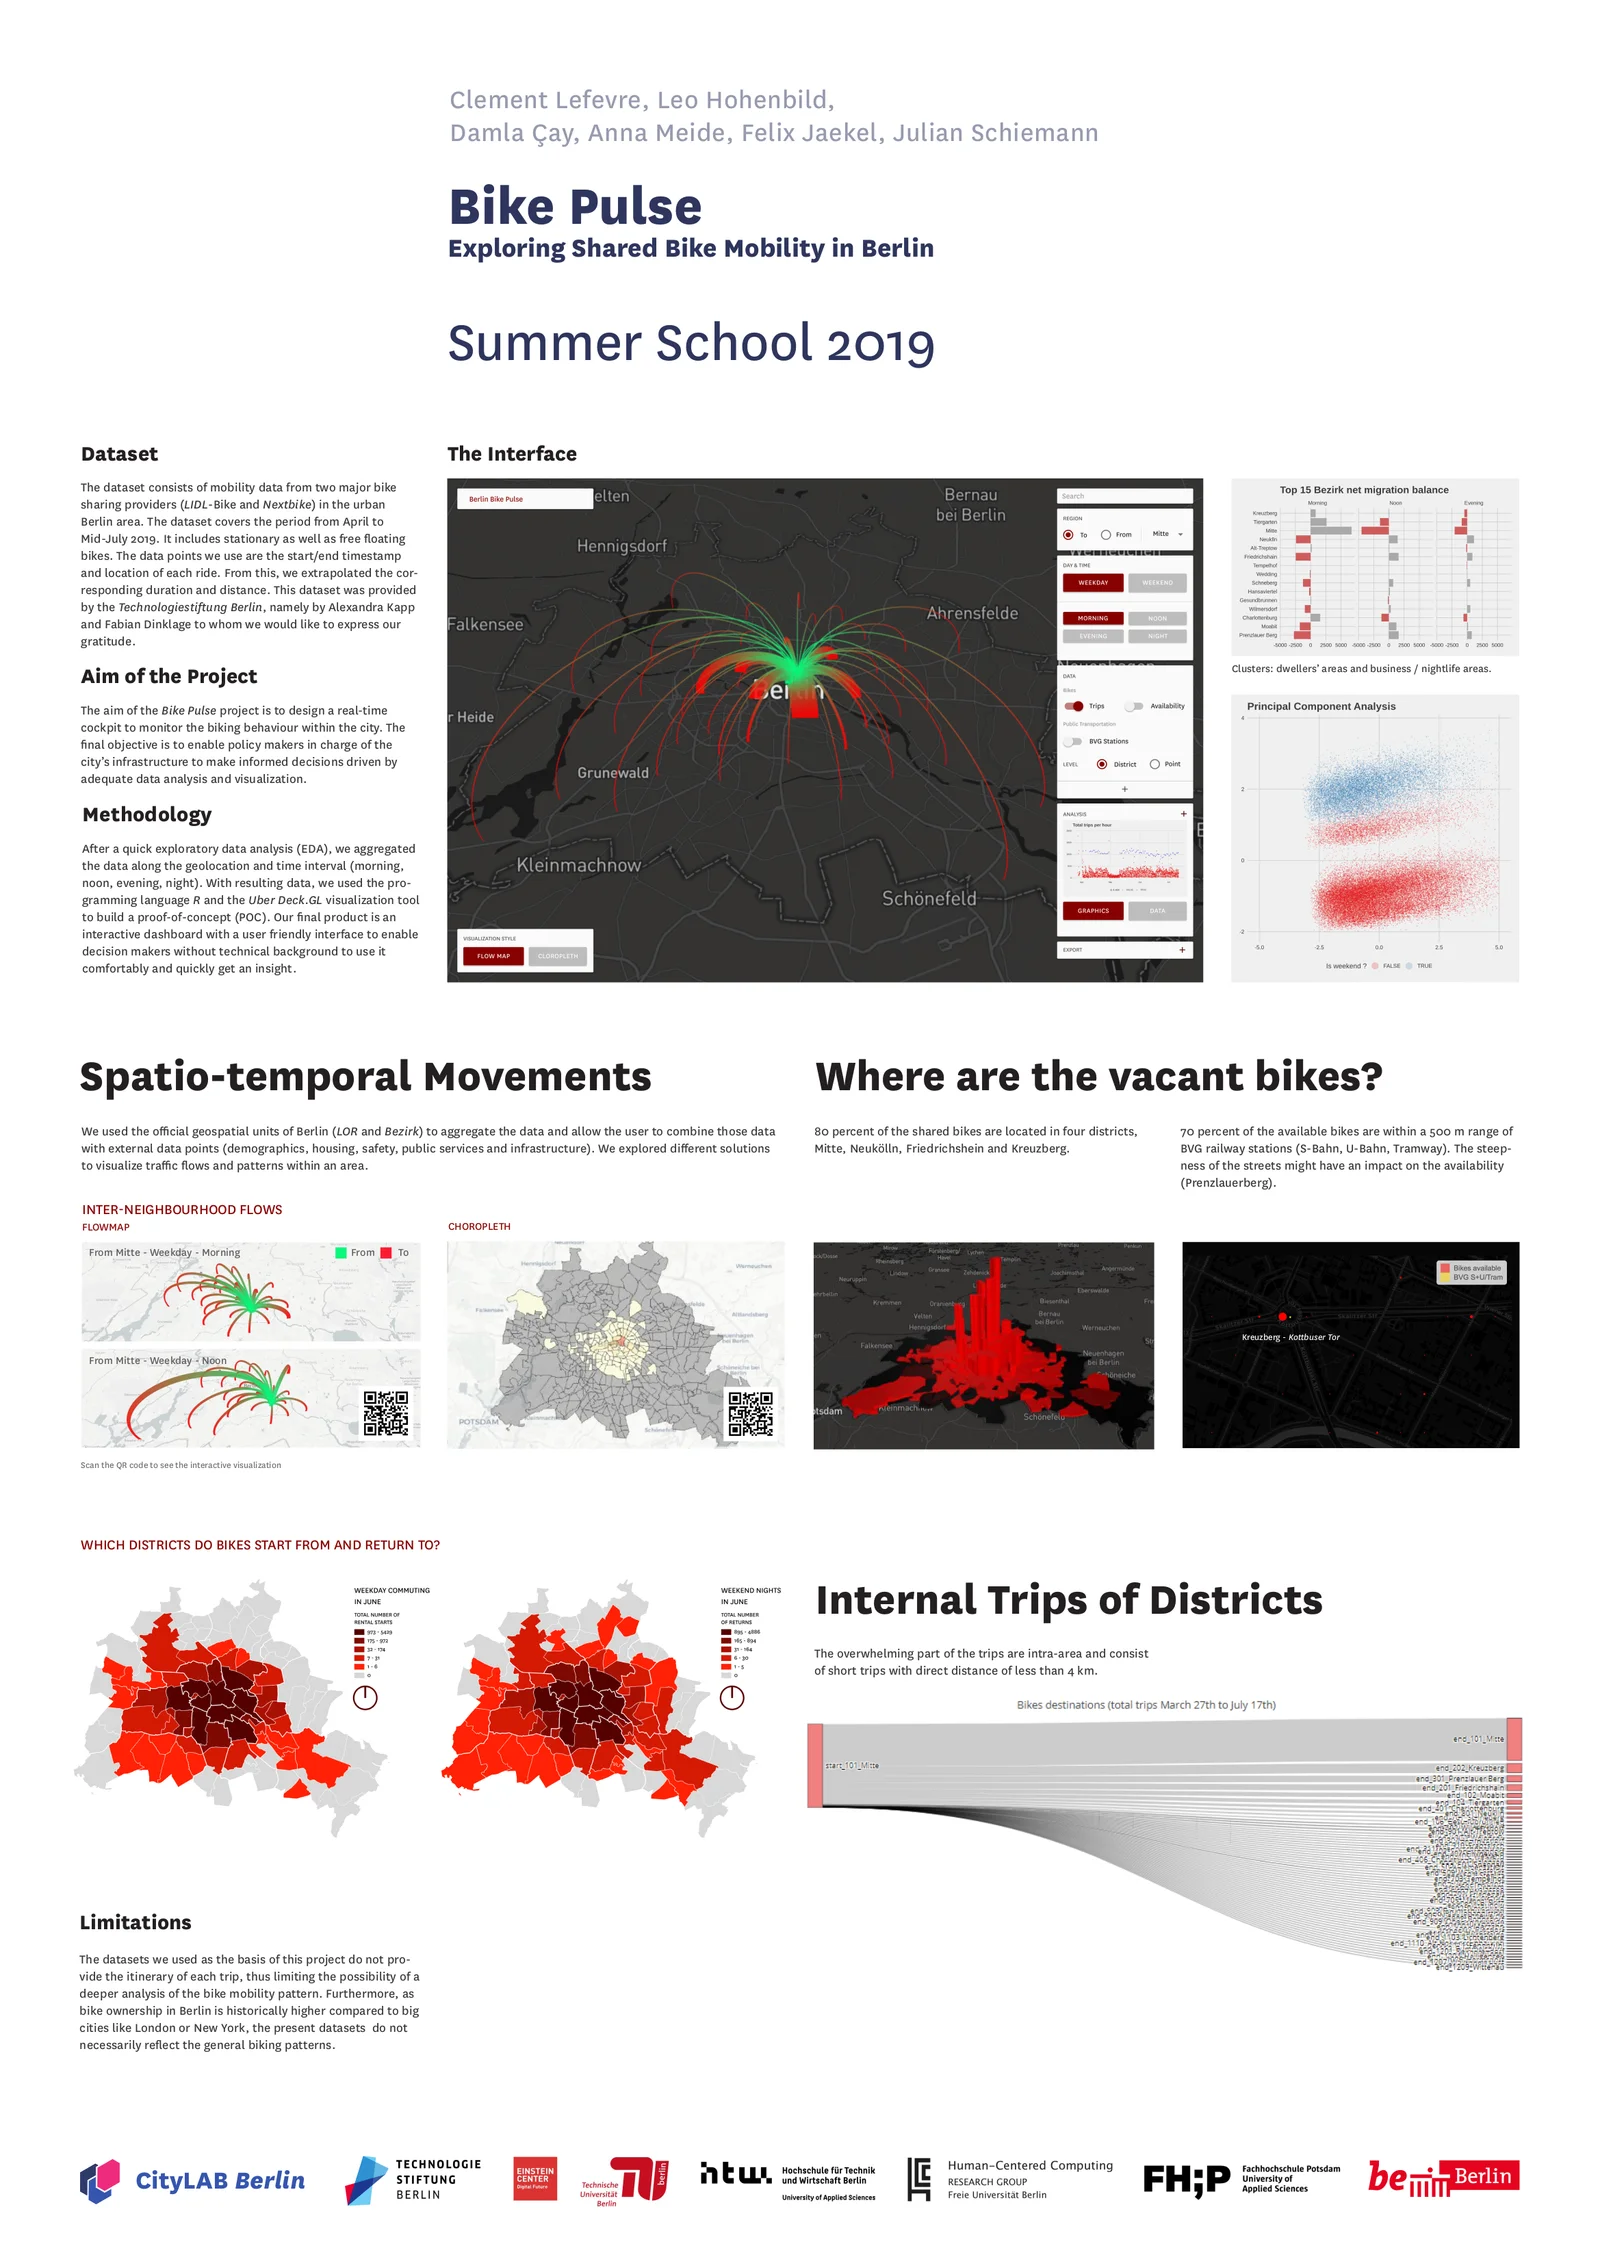
I had the chance to take part to the Berlin Technologie Foundation Seminar and realize a small project within a team.
Using data scrapped by the Berlin Technologiestiftung, we implemented a dashboard to visualize the flows of shared bike accross berlin.
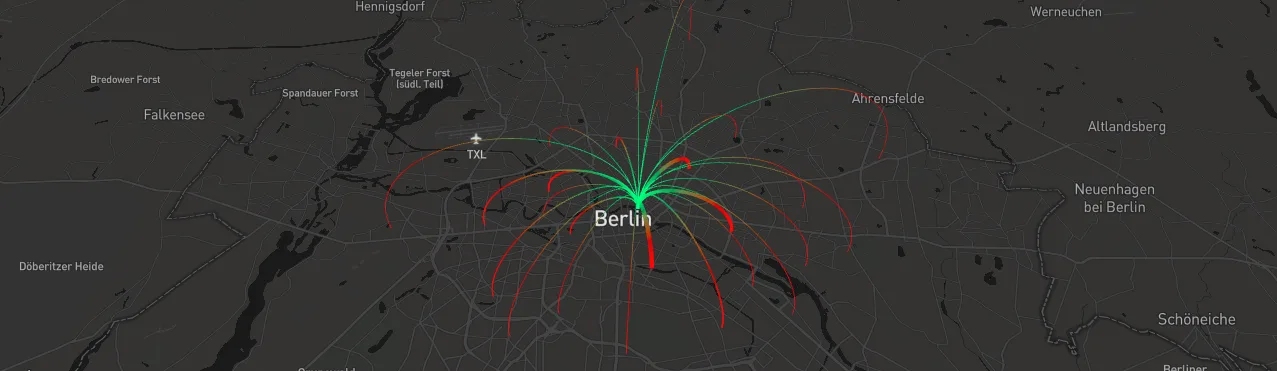
The trips are aggregated on the official Berlin planning areas (LOR) and four time slots (morning, noon, evening, night), split between weekdays and weekends. Pick a region to see where its bikes go (or come from), or click one on the map.
The dataset covers the Lidl-Bike and Nextbike fleets from April to mid-July 2019. It only holds the start and end position of each rental, not the actual route, hence the arcs.
The team: Clement Lefevre, Leo Hohenbild, Damla Çay, Anna Meide, Felix Jaekel and Julian Schiemann. Data provided by the Technologiestiftung Berlin (Alexandra Kapp and Fabian Dinklage). The original R Shiny app and the data preparation scripts are on GitHub.