Is there a pattern in our MEP vote behavior ?
Using the data retrieved from the Vote Watch NGO website for the 2014-19 European Parliementary session, i tried to rebuild this nice plot from the economist :
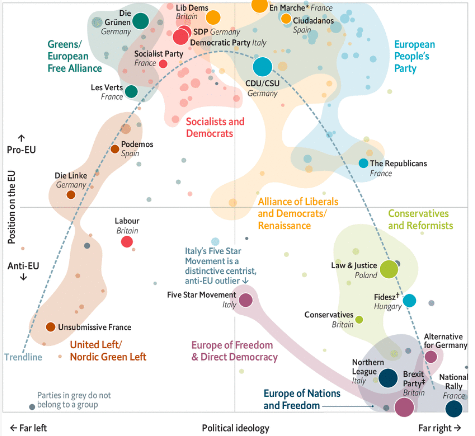
The Economist placed each party on two expert-rated axes, Left/Right and Pro/Anti-EU. I was interested to see whether the raw voting history alone would produce the same pattern.
The source code is available here
Methodology
i first scrapped the complete voting history for all the 800+ MEP members from VoteWatch Europe. Each vote was turned into a number: in favour +1, absent 0, abstained −1 and against −2. Then i used a PCA on the member / votes matrix, for all the votes together and for each of the 21 policy domains.
Try it
The first principal component carries most of the variance (80% over all votes, between 91 and 98% within a single domain), but it barely separates anyone: it is the "common vote" most MEPs share on the bulk of the texts.
The interesting axis is the second one. On its left end sit UKIP, the Brexit Party, the Rassemblement national and the rest of the ENF and EFDD groups; on its right end the grand coalition of the S&D, EPP and ALDE groups. Without any expert rating, the votes alone draw the Pro/Anti-EU axis of the Economist: a populist component.
Switch to Members and pick one to see their weekly attendance, and where it ranks among the 858 members of the term. The raw data (members, PCA coordinates, votes per session and the complete voting history) is in the data folder of the repo.